
🎮 Steam vs Mobile: Gaming Market Comparison 2025
Quick Summary
In 2025, Mobile leads in scale at **16B, yet offers better odds for new entrants: 30% of revenue flows to games released that year, with a ~2% success rate.
The two largest global game distribution platforms operate under fundamentally different economic logic. Understanding these differences helps developers choose the right launch channel for their budget and business goals.
Market Overview
| Metric | Steam (PC) | Mobile |
|---|---|---|
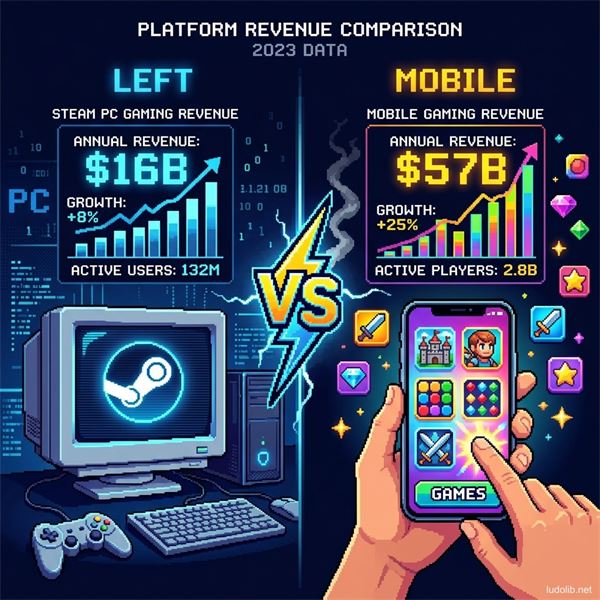
| Total Revenue 2025 | $16 billion [S1] | $57 billion [S1] |
| Monthly Active Users (MAU) | 147 million | ~3.2 billion |
| Peak Online / Downloads | 42 million concurrent users | 57 billion downloads |
Mobile is 3.5× larger than Steam by revenue and over 21× larger by user count. However, this massive scale carries significant trade-offs that developers must understand before entering the market.
New Releases (2025)
| Metric | Steam | Mobile |
|---|---|---|
| Total games released | ~19,700 titles | 41,639 titles |
| Revenue from new games | $5.5B (30% of total) | $2.7B (~5% of total) |
This gap reveals a critical truth: on Steam, new releases capture 30% of total revenue — a relatively fresh market for newcomers. On Mobile, 95% of revenue is held by entrenched titles (Clash of Clans, PUBG Mobile, Honor of Kings). New games entering Mobile face extreme competition for a narrow revenue slice.
Success Rate (Revenue)
| Metric | Steam | Mobile |
|---|---|---|
| New games earning >$1M | 324 titles (~2%) | 306 titles (~0.7%) |
| Games earning >$100K | 6,000+ titles (total) | 1.5% of games (dominated by old hits) |
Steam’s ~2% success rate for new games earning $1M+ is nearly three times higher than Mobile’s 0.7%. This is a primary reason many indie developers prioritize Steam as their first launch platform.
Genres & Trends
Steam — Depth-Driven Diversity
| Category | Details |
|---|---|
| Top genres | Crafting / Simulation / Strategy / Roguelike |
| Most viral | Co-Op |
| Highest demand | Action & Shooters (38% of all demand) |
| Mainstream trend | Souls-likes (200+ releases/year) |
Successful Steam games typically feature high systemic depth — players invest hundreds of hours. The Co-Op boom was driven by titles like REPO ($147M in 2025).
Mobile — Casual and Hybrid-Casual
| Category | Details |
|---|---|
| Top genres | Puzzle (Sort & Block) / 4X Strategy / Idle |
| Main trend | Hybrid-Casual |
Hybrid-Casual blends a simple gameplay core (such as a sorting puzzle) with deeper monetization systems than traditional casual games. This is the fastest-growing mobile segment in 2024–2025.
Notable 2025 Hits
Steam
| Rank | Title | Revenue |
|---|---|---|
| 1 | Schedule I | $151M |
| 2 | R.E.P.O | $147M |
| 3 | PEAK | $87M |
Mobile
| Rank | Title | Revenue |
|---|---|---|
| 1 | Kingshot | $785M |
| 2 | Pixel Flow | $78M |
| 3 | Knit Out | $20M |
Kingshot ($785M) — a 4X strategy title — generated more revenue than all three top Steam hits combined. This reflects the sustained dominance of Live Service and in-app purchases as Mobile’s primary monetization architecture.
Platform Selection: Key Trade-offs
| Factor | Steam | Mobile |
|---|---|---|
| Best for | Indie, mid-tier, depth-heavy games | Casual, hybrid-casual, large UA budget |
| Opportunity for new games | Better (30% of revenue from new releases) | Difficult (5% of revenue for new releases) |
| User Acquisition cost | Lower (word-of-mouth, Wishlist system) | High — CPI rising continuously |
| Revenue lifecycle | Launch-heavy (front-loaded revenue) | Long-tail if a hit is achieved |
| Risk level | Manageable | High without sufficient UA budget |
Steam: High demand for fresh content — 30% of money goes to new games, better odds for indies. Mobile: Massive scale, but 95% of revenue is locked by older titles — tougher for new entrants.
See Also
- AAA vs Indie — production scale segmentation in the game industry
- Game Monetization Models — comparing Premium, Freemium, Subscription
- CPI — Cost Per Install, the core Mobile user acquisition metric
- IAP — In-App Purchase, the primary Mobile monetization mechanism
- Live Service — long-term game operation model
- Distribution Platforms — overview of major game distribution platforms
References
- [S1] AppMagic & Steam Spy — 2025 game market data, compiled by Anton Slashcev (2025).
- Newzoo Global Games Market Report 2025
- Steam Database — Revenue Estimates